Charting & Charting Styles ‘Charting’ is essentially the most basic component of technical analysis. As such, some would argue that the more raw and basic data plotted on a chart is of little use to the technical trader. Instead, they might argue that a technical trader needs more advanced indicators as a means of determining price direction. Indicators such as moving averages, momentum indicators, oscillators and so on… will, ultimately be of grand use to the technical trader, but not without first learning the basics!
Line Charts There is nothing more basic than a line chart. A simple visual representation of data, the Line Chart plots the closing price of a single day and over the course of weeks and months connects the dots. The below image shows an example of a basic line chart:
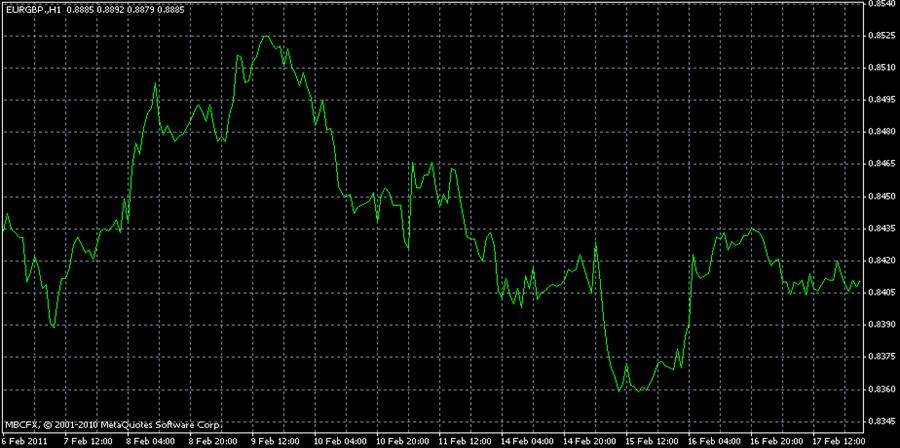
The line chart’s simplicity is often seen as its strength. Or so it may be in other markets. In the Forex market the line chart offers very little insight into the market’s volatility or movement within the time frame of a single day. As most Forex traders are ‘day traders’ (often in and out of positions in a 24 hour period) a line chart, even if plotted by the hour, would still leave much to be desired. As we continue to explain other charting methods, the previous point will make more sense!
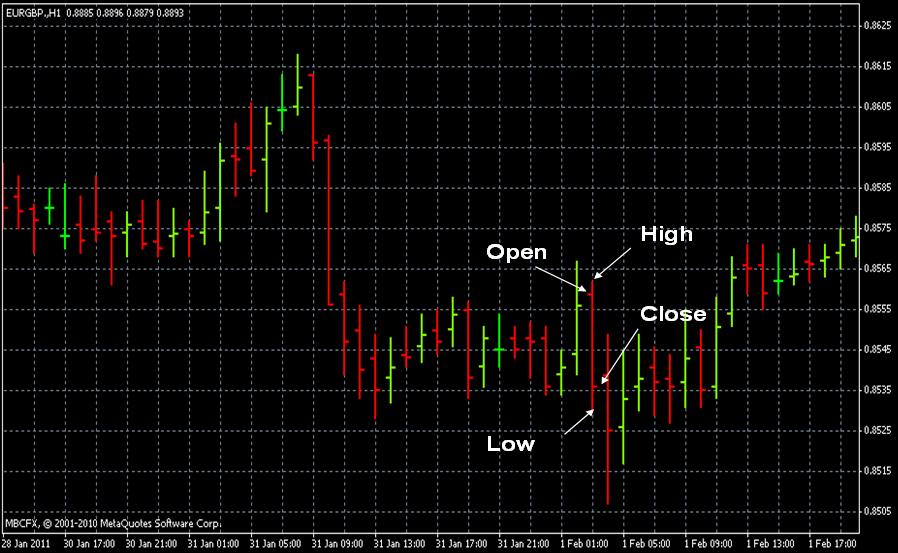
Bar Charts Bar charts are in essence the less visually appealing version of Candlestick charts. Candlestick charting is the most popular method used by today’s Forex traders. However, it might be important to understand the one before the other. A Bar Chart displays a price’s open, high, low and closing prices. As shown in the image below the top of the bar chart represents the highest price of the period, and the bottom of the bar represents the lowest price of the period. To the left and right side of the bar are “ticks”, the left tick represents the open price of the period and the right tick represents the close price of the period.
Candlestick Charts Really the only choice for today’s Forex traders, the candlestick chart offers the same information as does a bar chart, but does so in a much more ascetically pleasing manner. As is illustrated in the two images below the candlestick is comprised of a “body” and an upper and lower “wick”. The body of the candle is typically a dark color when the close is at a lower price than was the open (a bearish candle). Conversely, if the close is at a higher price than was the open the candle will be a light color (a bullish candle). The wick of the candle represents the entire range of price for that period. The top of wick of course represents the price at its highest point, while the bottom of the wick represents the price at its lowest point. A quick glance at a candlestick will tell a trained eye literally everything they might want to know about a price within a certain time frame, i.e. what was the high and low price, was it bullish or bearish, where was the open and close. A trader can also quickly glance at a series of candles and with little thought note how many consecutive candles have been bullish or bearish; which in conjunction with other technical analysis often serves as an appropriate timing method to enter a trade.
What am I Looking For? More often than not, traders in the Forex market doom their own technical analysis. The reason is simple; they look at a chart and try to remember everything that they have ever studied about technical analysis. Before long it seems that one philosophy only contradicts another, an obvious entry becomes a source of confusion and so on. Some of the best traders in world have a bit of a mental check list that is always considered when analyzing a chart. However, they also know that too many technical indicators used in conjunction with one another is a fast track to a certain demise.
There are certainly a few things that you are going to want to consider when looking at a chart. As the course continues you will be better prepared to compile your own trading style. For the time being, consider the following a check list for the novice. Ask yourself what the chart on your screen is telling you, and which of the following considerations are worth considering:
Is there an obvious trend or direction of the market within the time frame that you are viewing?
Are there any basic chart formations such as ascending or descending triangles, wedges, pennants, double tops or bottoms or otherwise that might suggest a pending breakout or trend reversal.
Is the market trading within the walls of any obvious support and resistance levels, or is the market trading within a channel?
Have you considered at least two technical indicators, i.e. two technical indicators that complement each other well?
Have you ignored the impulse to consider every technical indicator that you have ever read a paragraph or two on?
You should now understand at least the basics of what a technical trader is looking for when analyzing a chart and the market. As we continue to dissect various technical indicators and forms of pattern recognition your skills will be refined, for the time being it is enough to know, if nothing else, what it is that you will ultimately be looking for.
Support & Resistance Trends Fortunately for traders in the Forex market, dealing in this market is often about dealing in trends. It is often said that ‘the trend is your friend’; there is truth to this, but only when a trader understands why the market trends and the underlining factors that can often disassemble a forming trend (these factors will be covered throughout the course as we further analyze technical analysis).
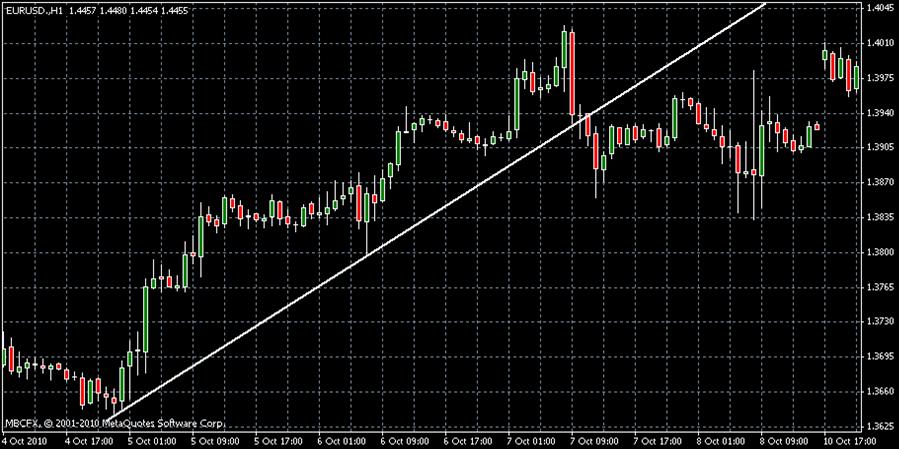
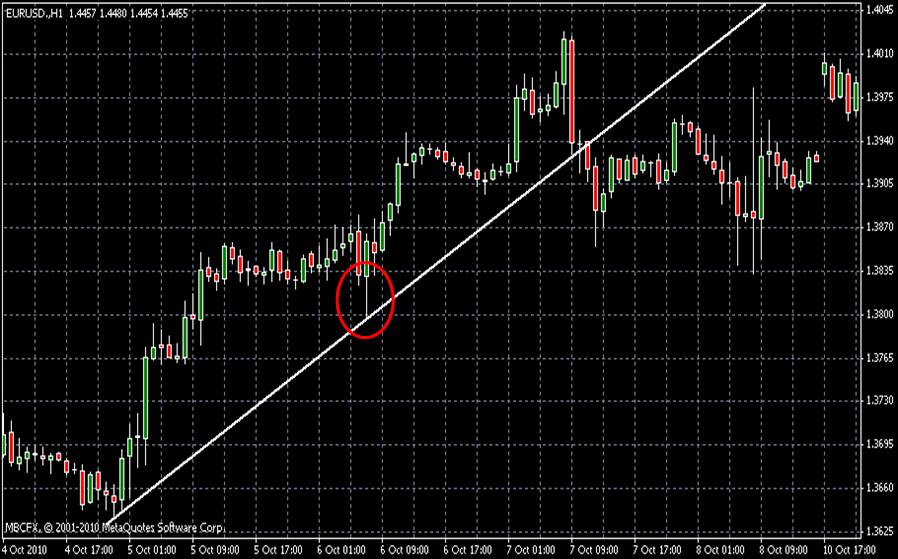
The image above shows an example of an upwards trend. Notice that the trend line was drawn by identifying the lowest low of the trend and connecting the line to the following low preceding a new high. A solid trend line should continue in this manner until at least four lows followed by new highs are plotted. This trend line can also be referred to as a support level. In other words, think of this line as if it were the roof of a house. During this trend period the price range is going to crawl along the roof of the house. In an upwards trend we are obviously looking for an opportunity to buy. It is generally taught that a trader’s best buy entry point during an upwards trend would be at the lowest low of the candle on the third touch of the support level, as shown below:
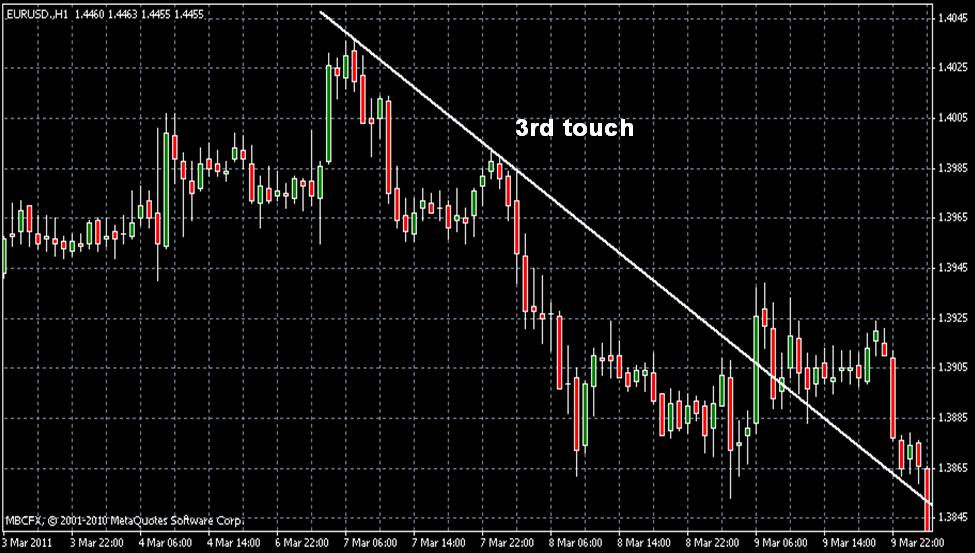
Just the opposite of an upwards trend, in a downwards trend our trend line can be referred to as a resistance level. Now as opposed to trading along the outside of a roof we are trading along the top of the ceiling. During this trend a trader can assume that the price is often going to reach the ceiling, but never push through it. A trader following a well developed downwards trend is looking for an opportunity to sell on the third touch of the resistance line at the highest possible point of the candle, as shown below:
Timing an entry point within a trend is as key as recognizing a trend, as obviously they will not last forever. First consider the time frame of the chart that you are viewing in relation to the likely continuance of the trend. As mentioned earlier, we are usually looking to buy or sell on the third touch of a support or resistance level within a trend. Using historical data in your charts, you will notice that the average trend will not provide more than 3 to 4 additional touches of the support or resistance after the first 3 that would have inspired you to note the trend to begin with. Thus, depending upon whether you are viewing a 1 minute chart, a 5 minute chart, or so on you will need to gage an estimated time frame within which you will trade.

 عربي
عربي Español
 Français
 Polski
 Deutsch
 中文(简单)
 中文(簡體)
 Pусский